Computer Science and the Social Sciences
Prepared for the 2023 meeting of the Computer Science Teacher’s Association
2023-06-24
About me
Some background info:
Political Scientist
Research focus:
- US foreign policy
- Political economy of security cooperation
- Social, political, and economic effects of US military deployments
- Statistical research methods
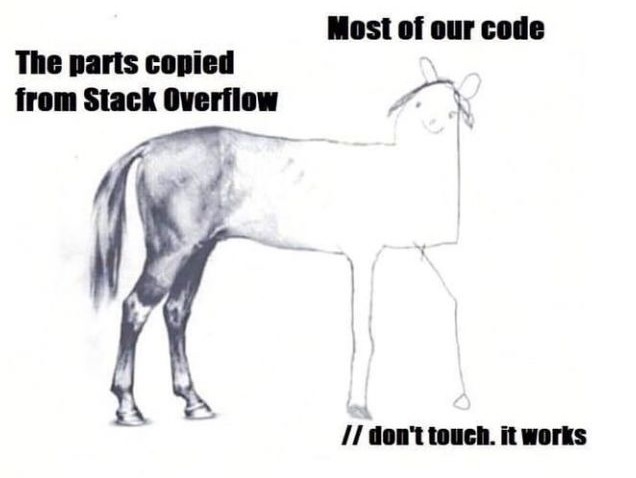
A Disclaimer

Social Science Workflow?
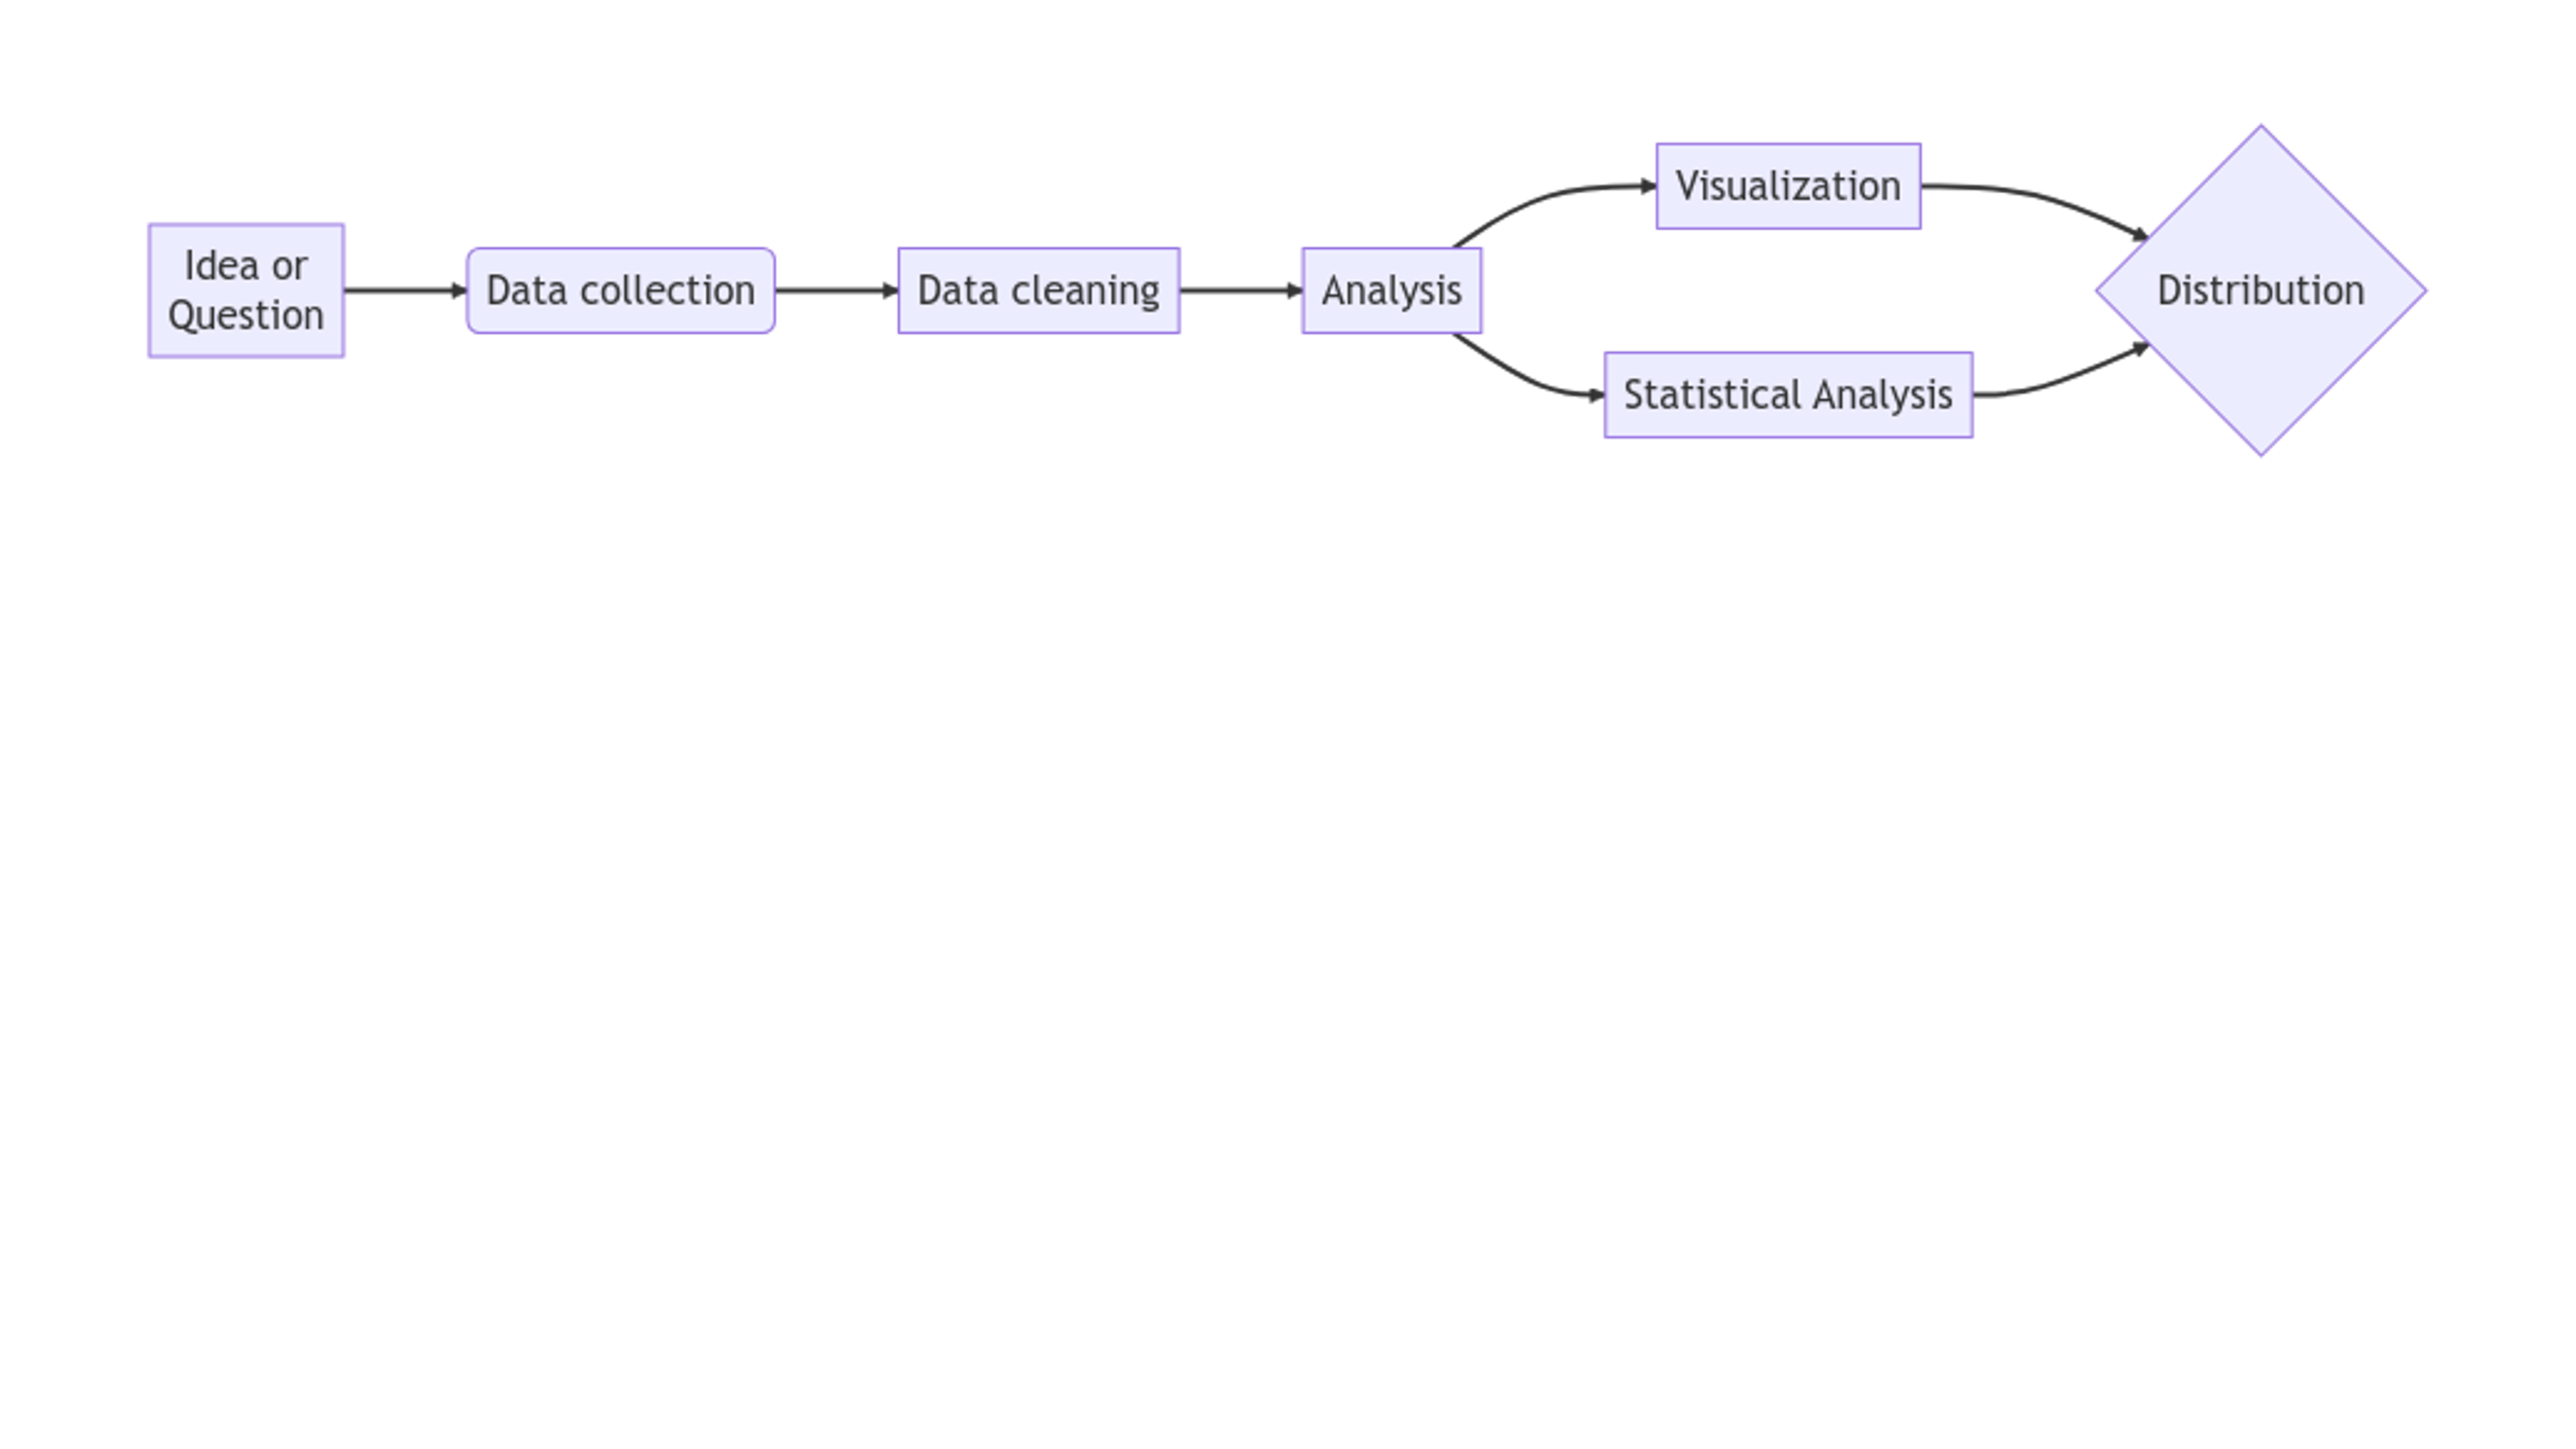
Social Science Workflow?
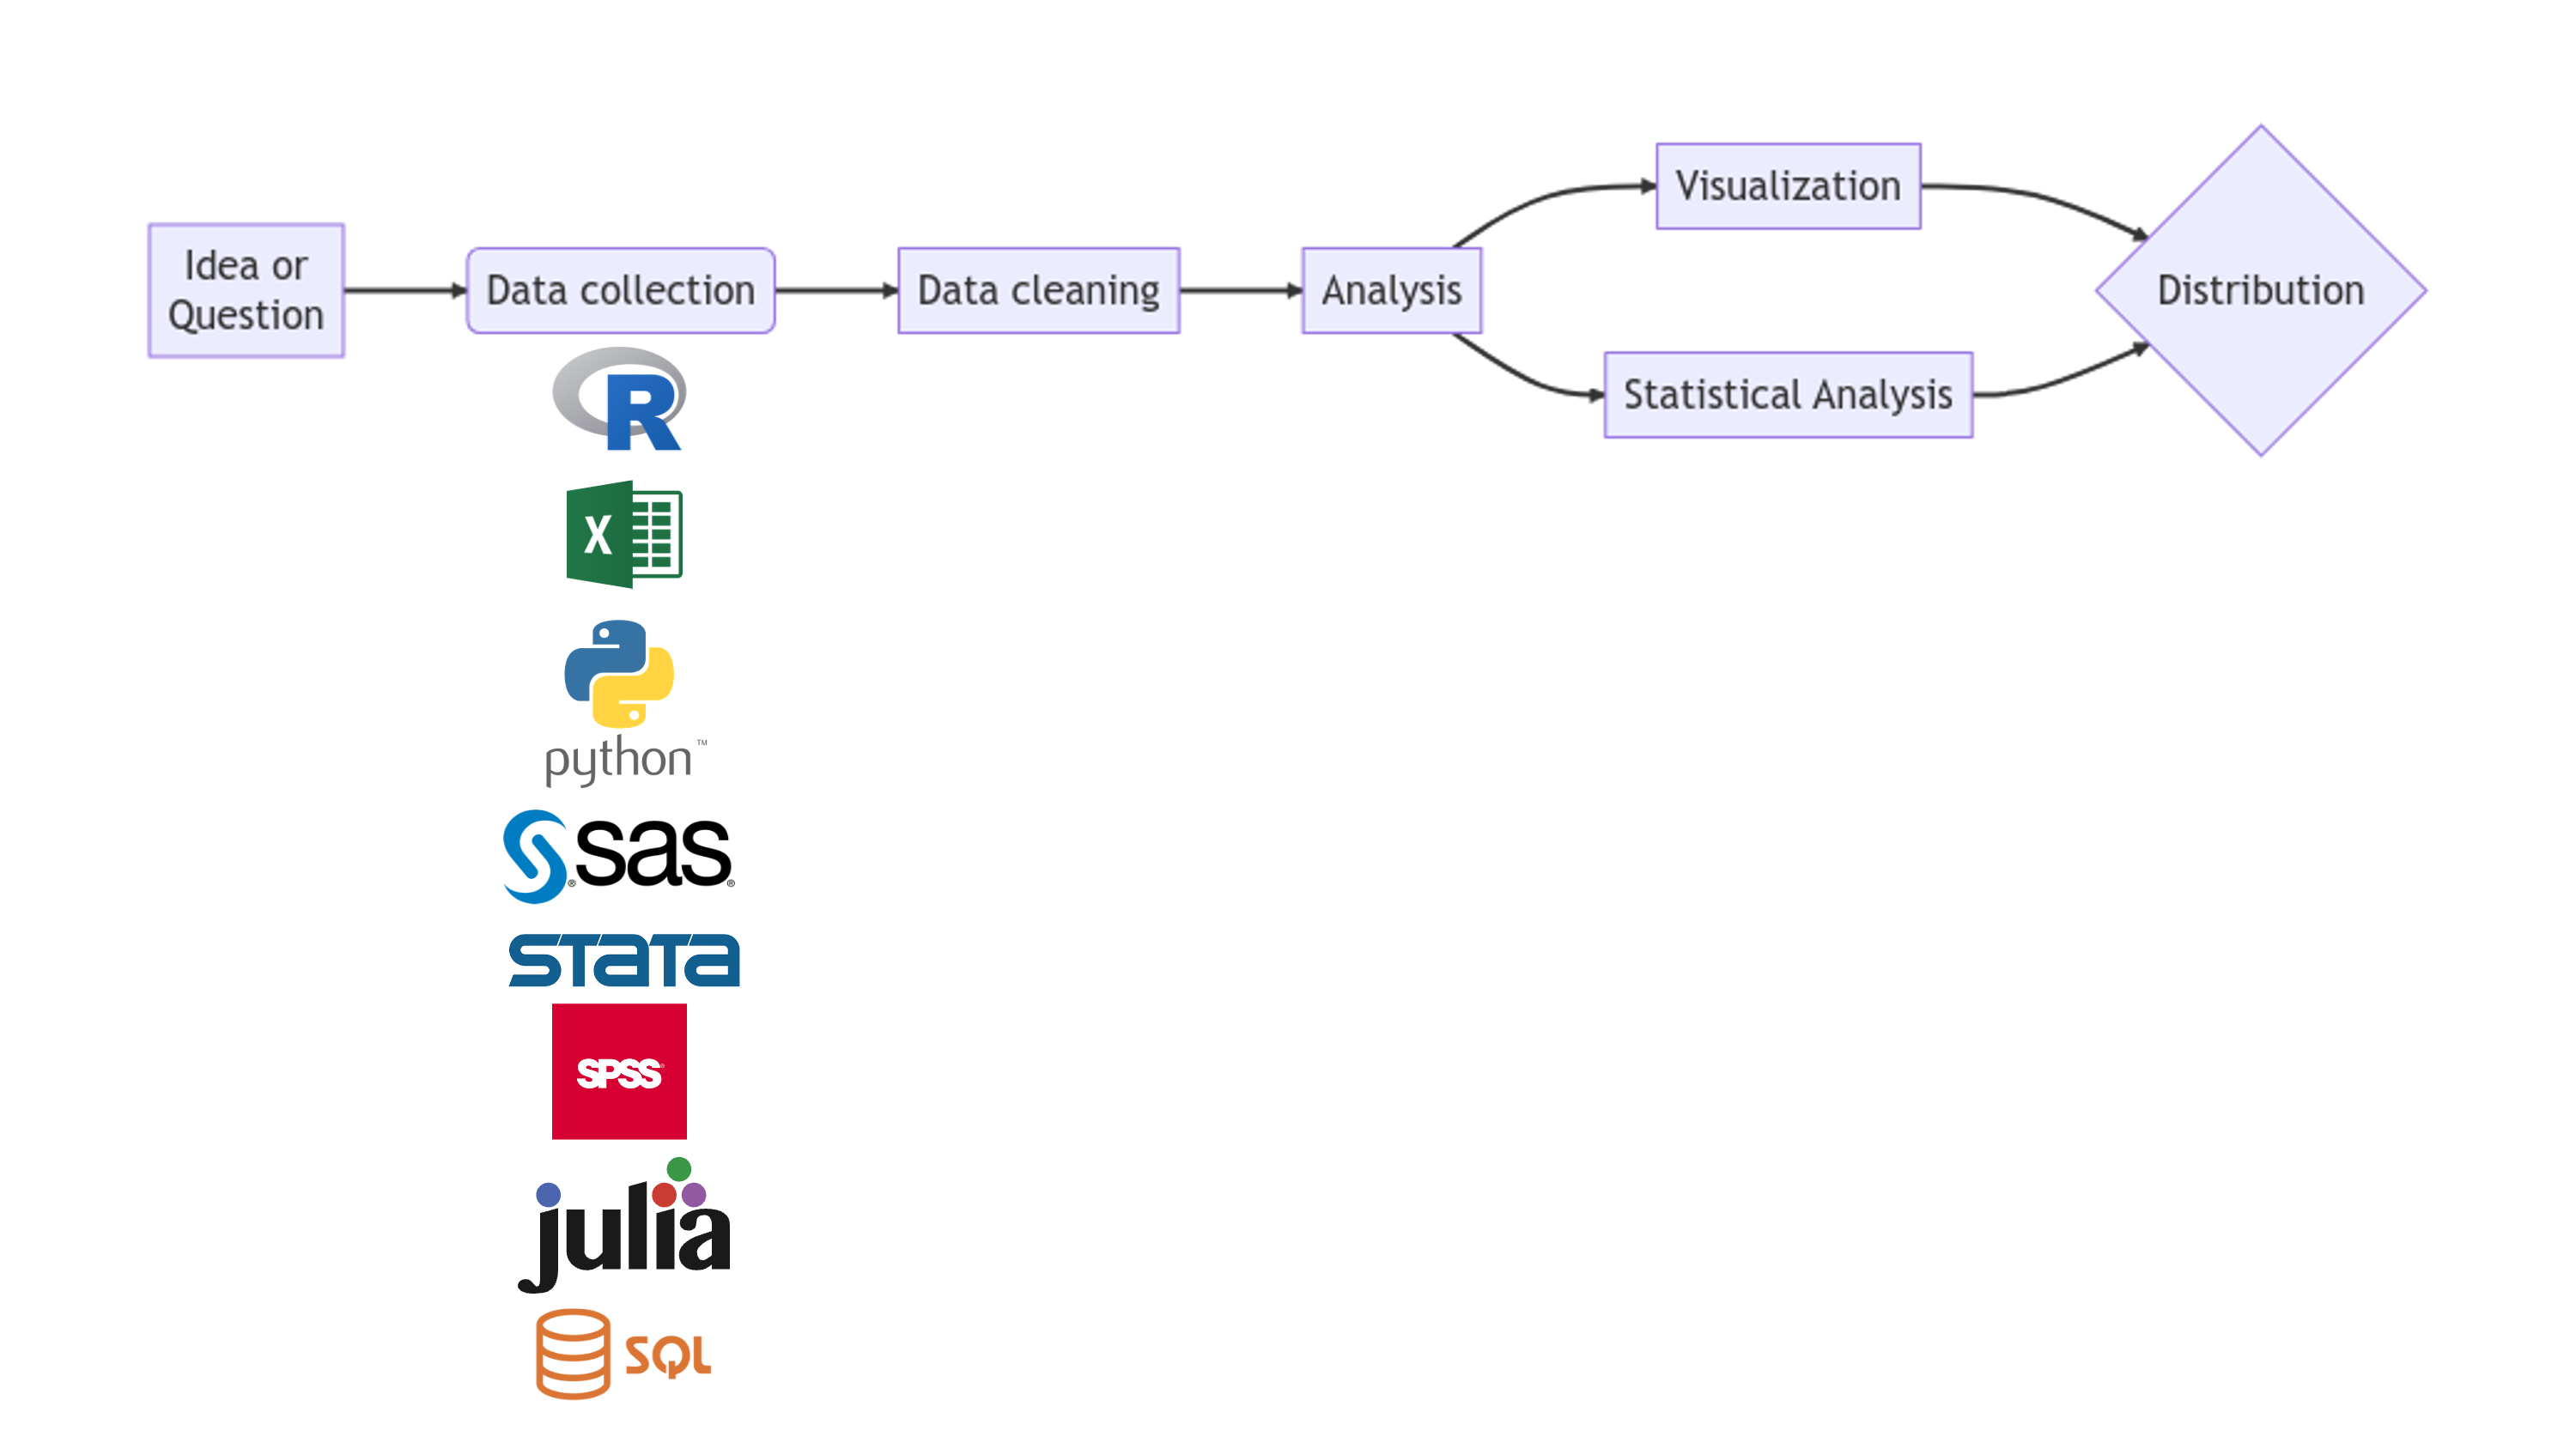
Social Science Workflow?
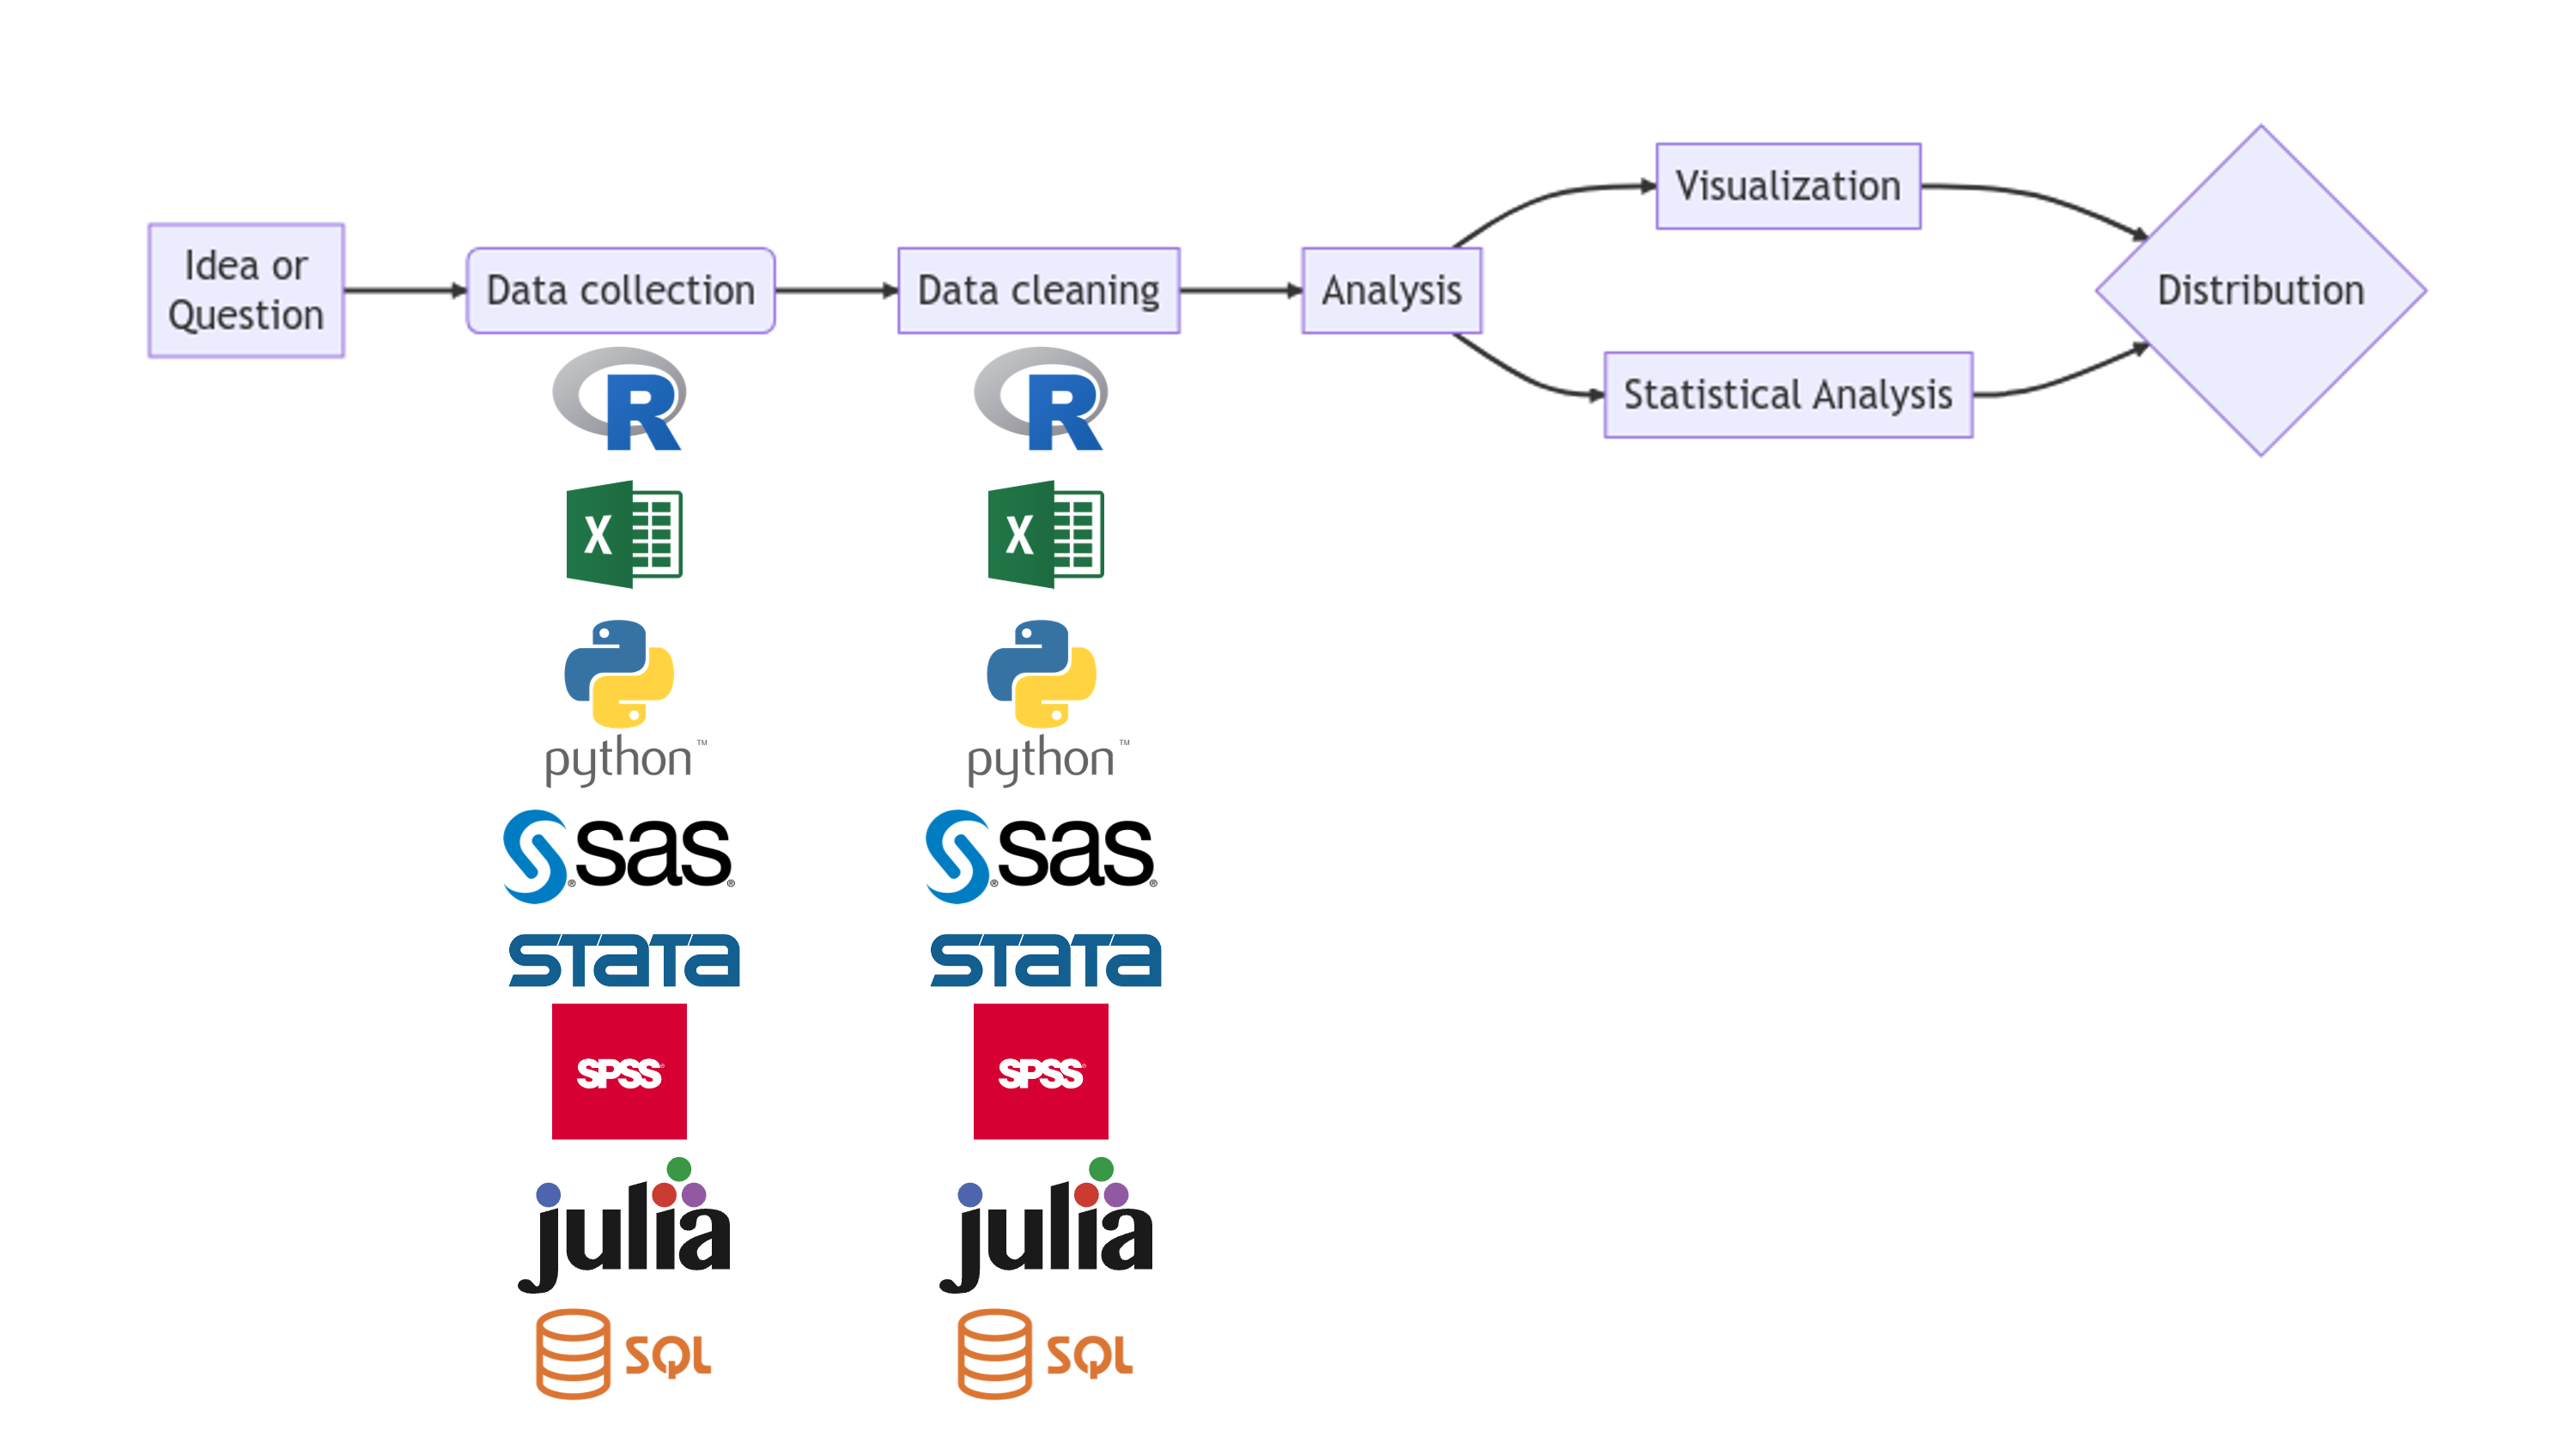
Social Science Workflow?
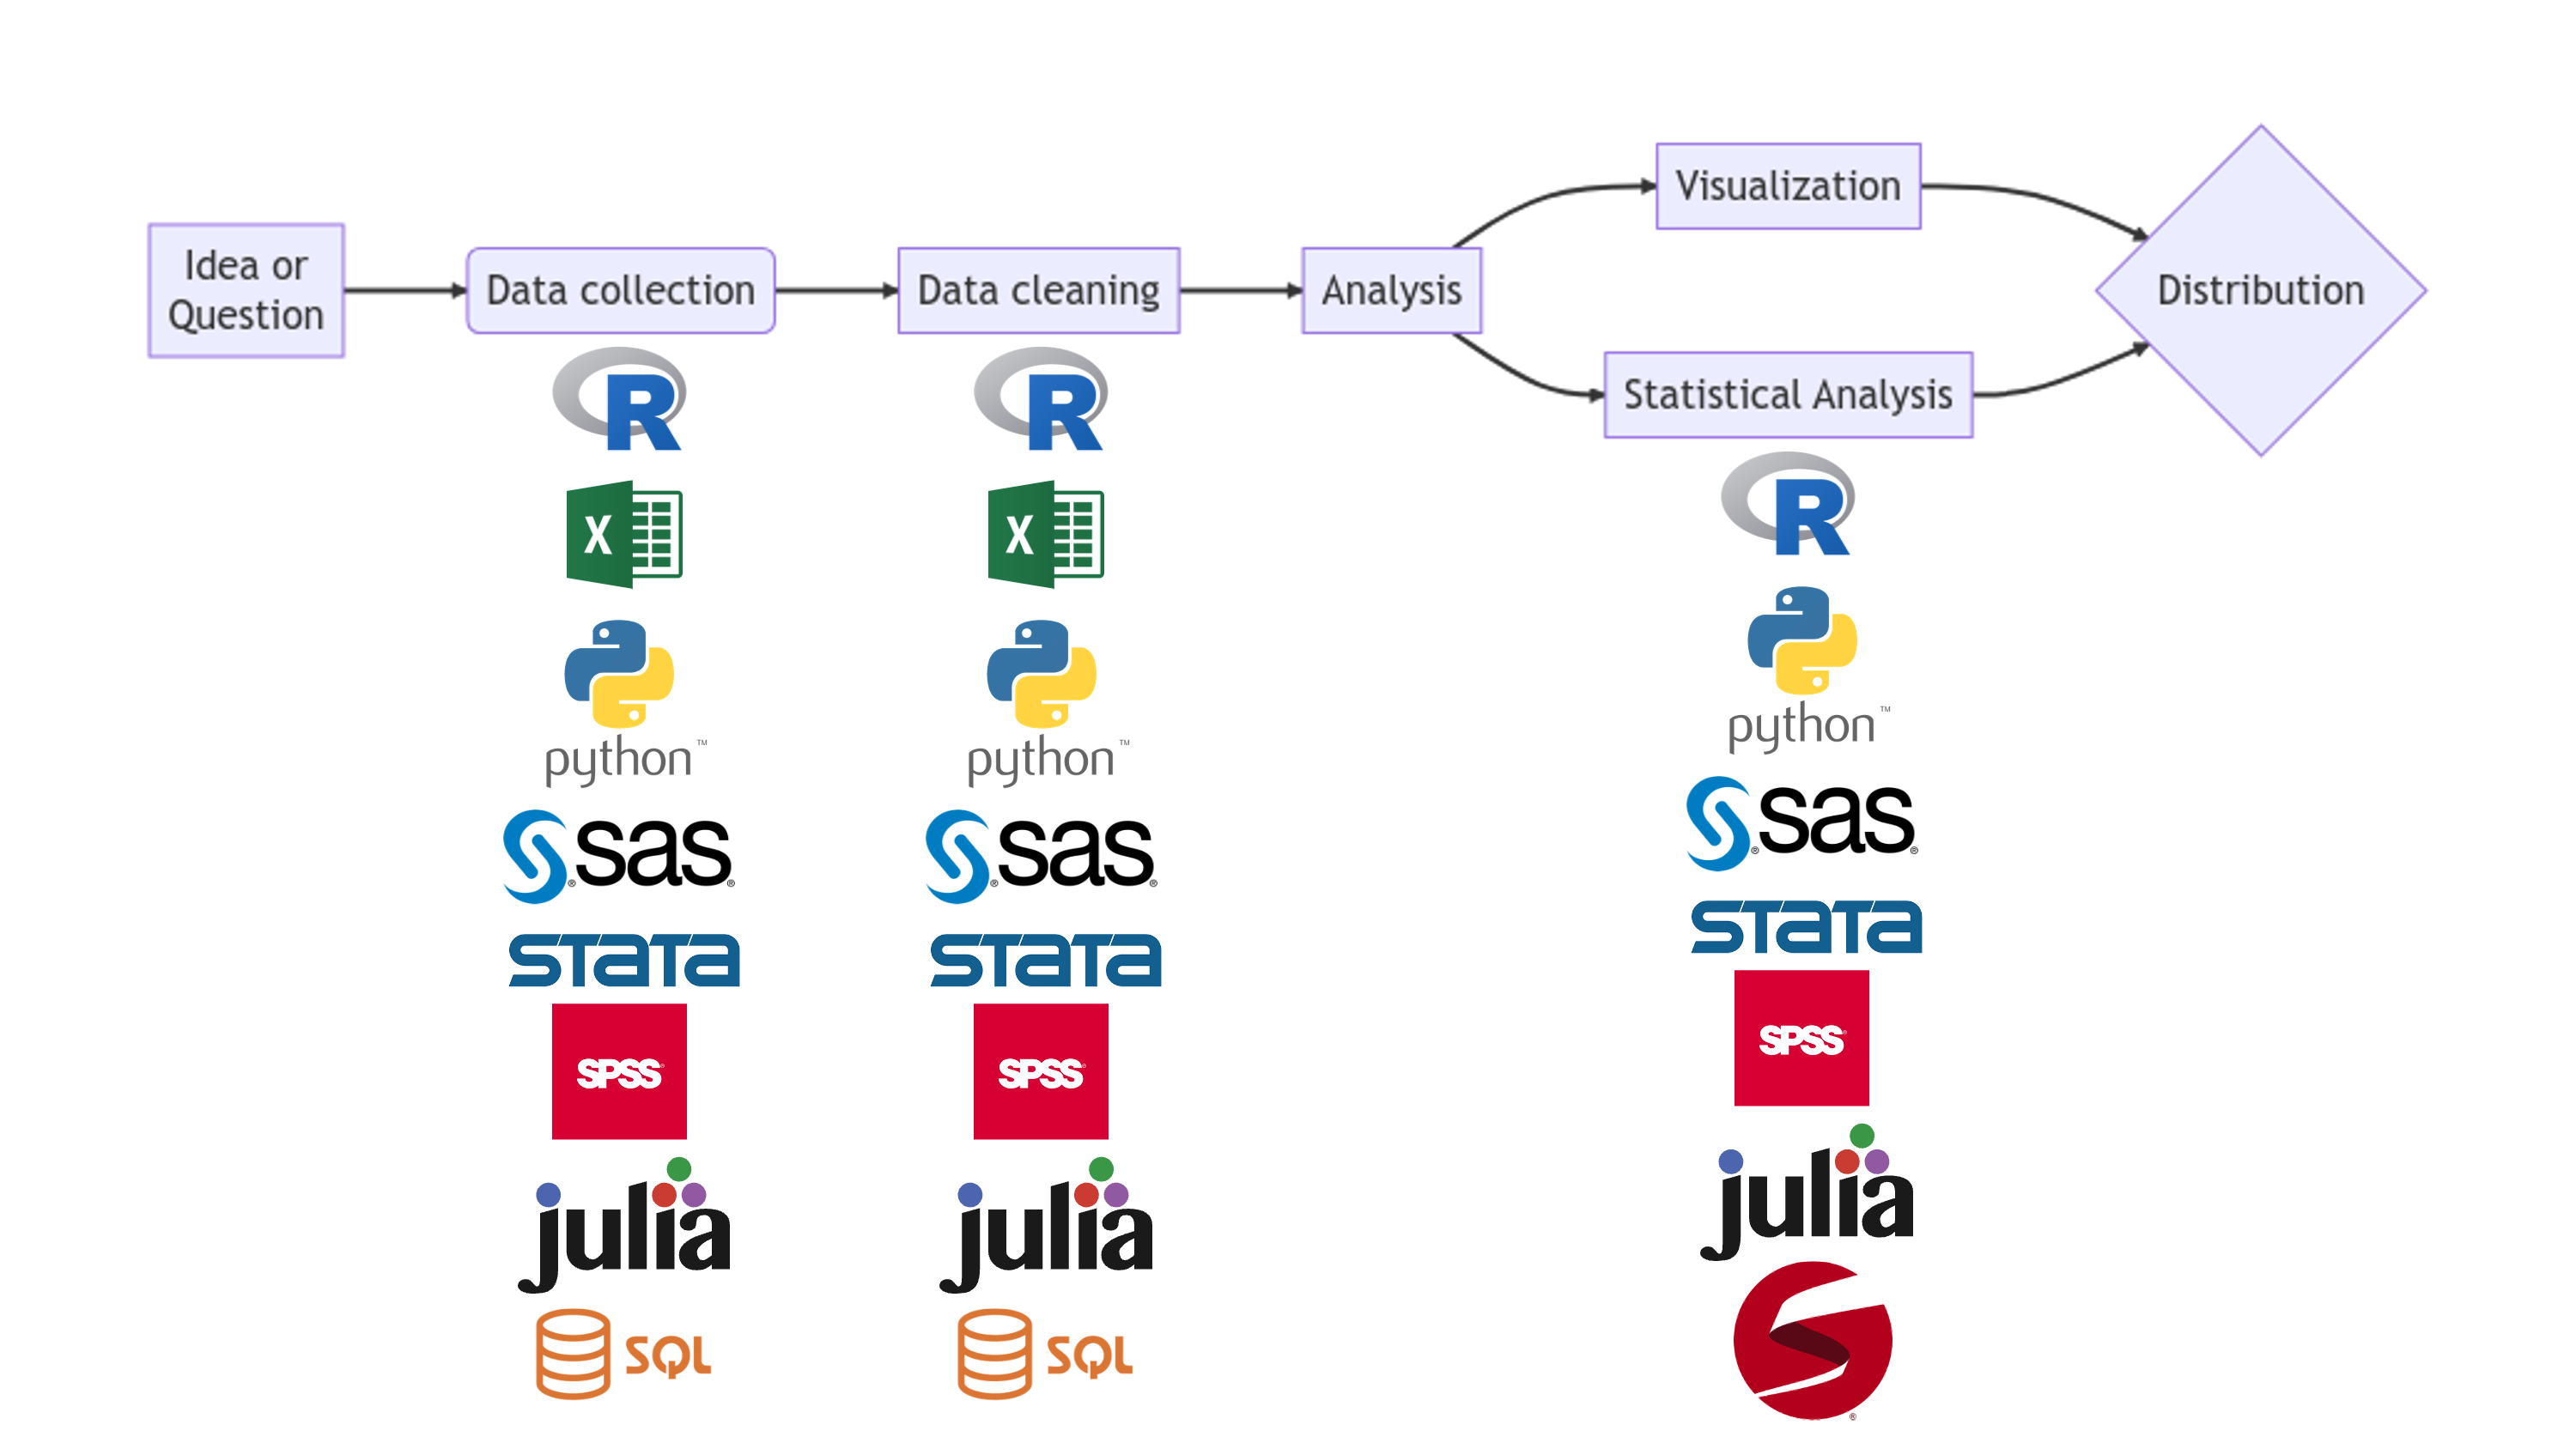
Social Science Workflow?
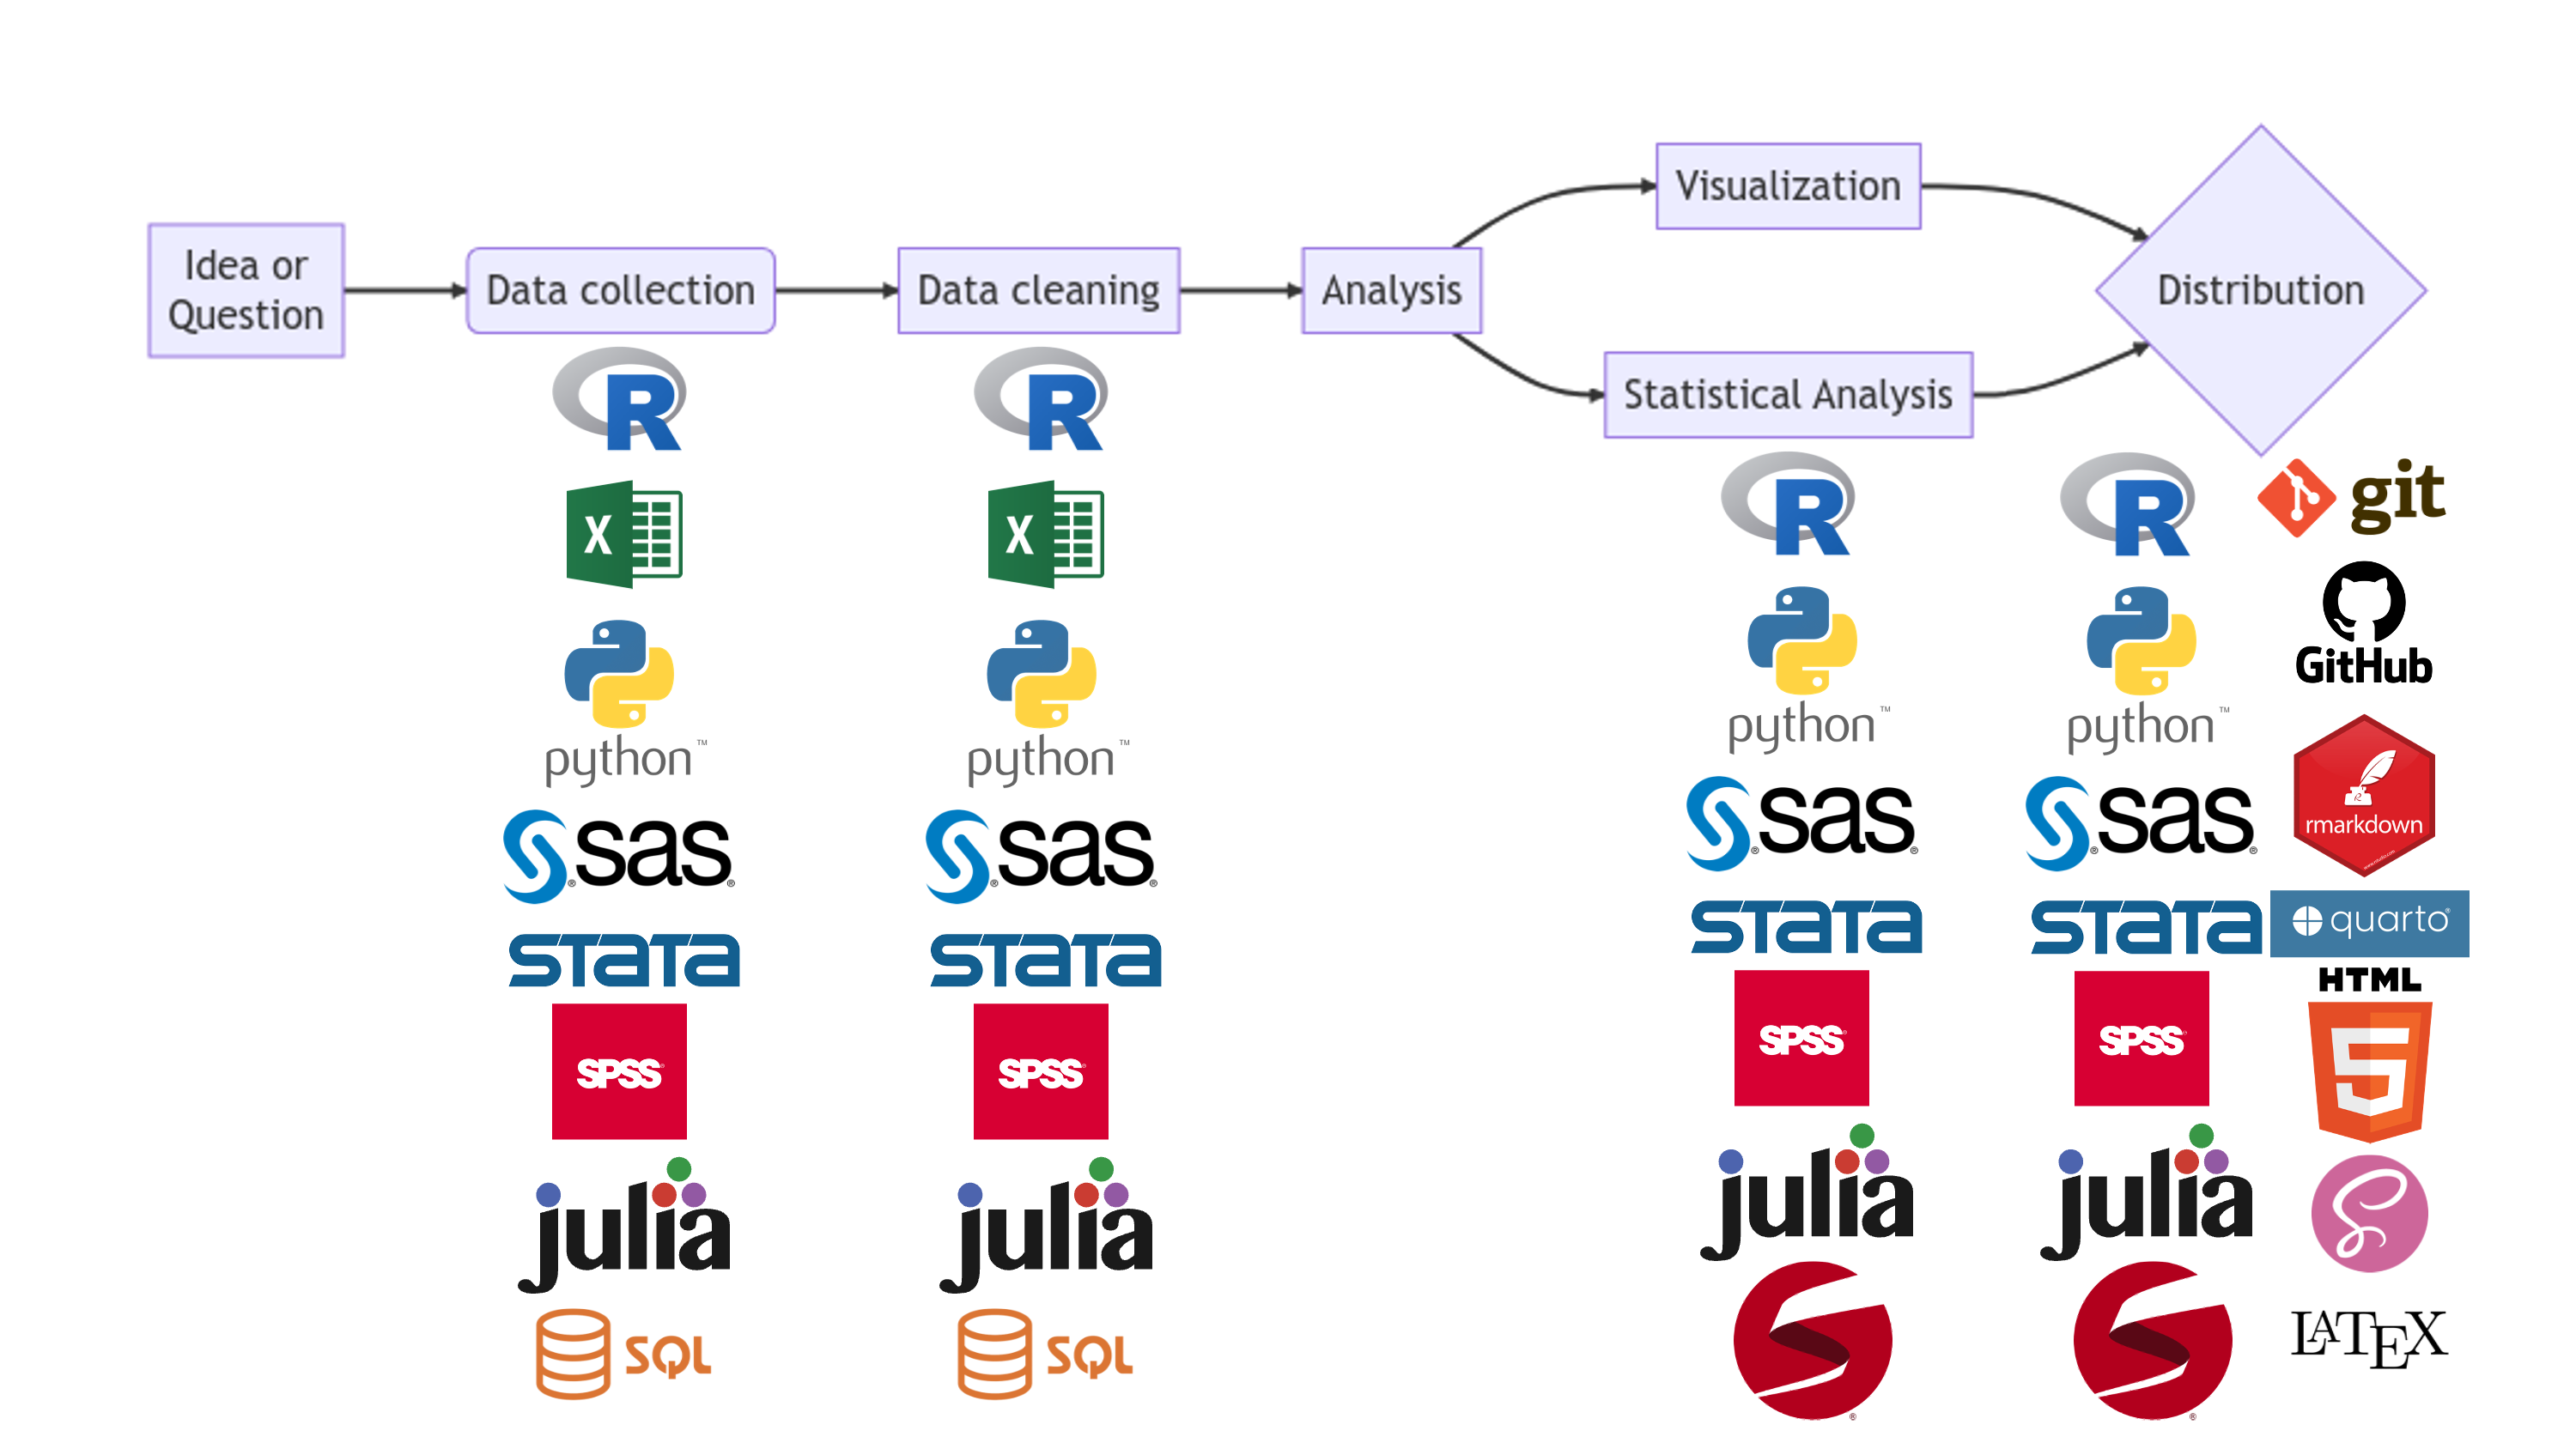
Social Science Workflow?
Social Science Workflow?
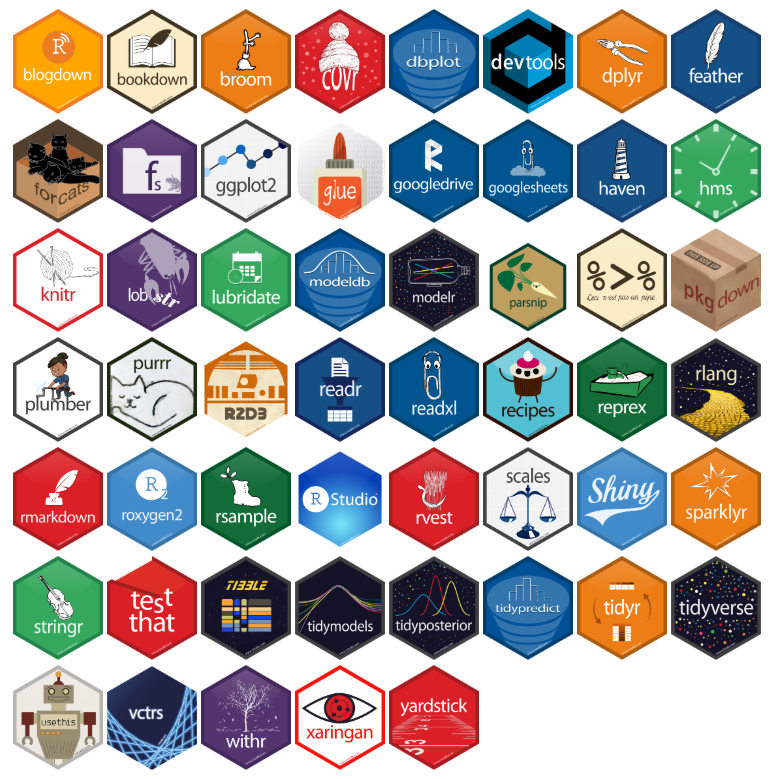
Reasons to like R
- It’s free!
- Open source
- Widely used in academia, government, industry, etc.
- Accessible
- Statistical analysis
- Writing
- Distribution
- Web scraping
- Data management
- Integrates with several other languages
![]()
Data Analysis
You can make great slides like these with Quarto, and even include code chunks and output!
library(flynnprojects) # Load library for theme
library(tidyverse) # Load tidyverse

data <- tibble(x = rnorm(n = 1e4, # Generate some fake data. 10k obs with mean at 0 and standard deviation of 2
                         mean = 0,
                         sd = 2))

ggplot(data, aes(x = x)) + # Plot the data
  geom_density() +
  theme_flynn() +
  labs(x = "x",
       y = "Density")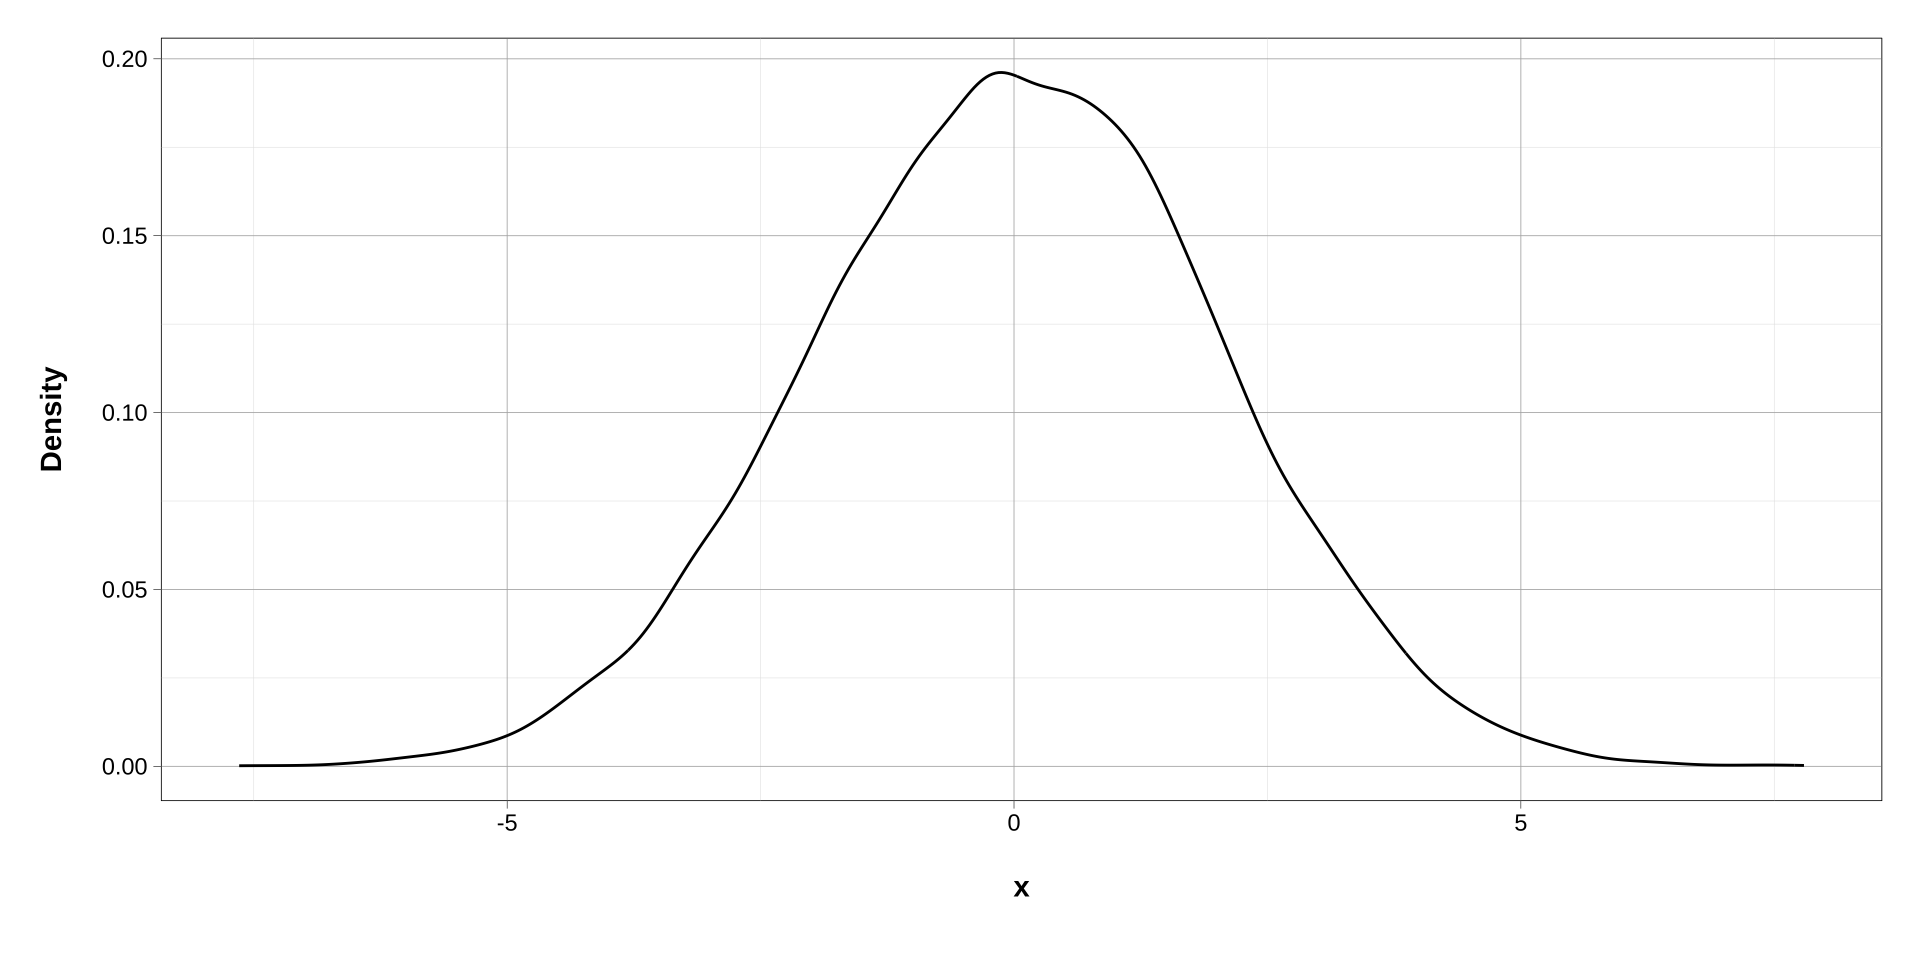
Maps
library(sf)
#devtools::install_github("UrbanInstitute/urbnmapr")
library(urbnmapr)

map <- get_urbn_map(map = "counties",
                    sf = TRUE)

ggplot() +
  geom_sf(data = map,
          aes(geometry = geometry,
              fill = state_abbv == "KS")) +
  guides(fill = "none") +
  theme_void() +
  viridis::scale_fill_viridis(discrete = TRUE,
                              option = "magma",
                              begin = 0.2,
                              end = 0.9,
                              direction = -1)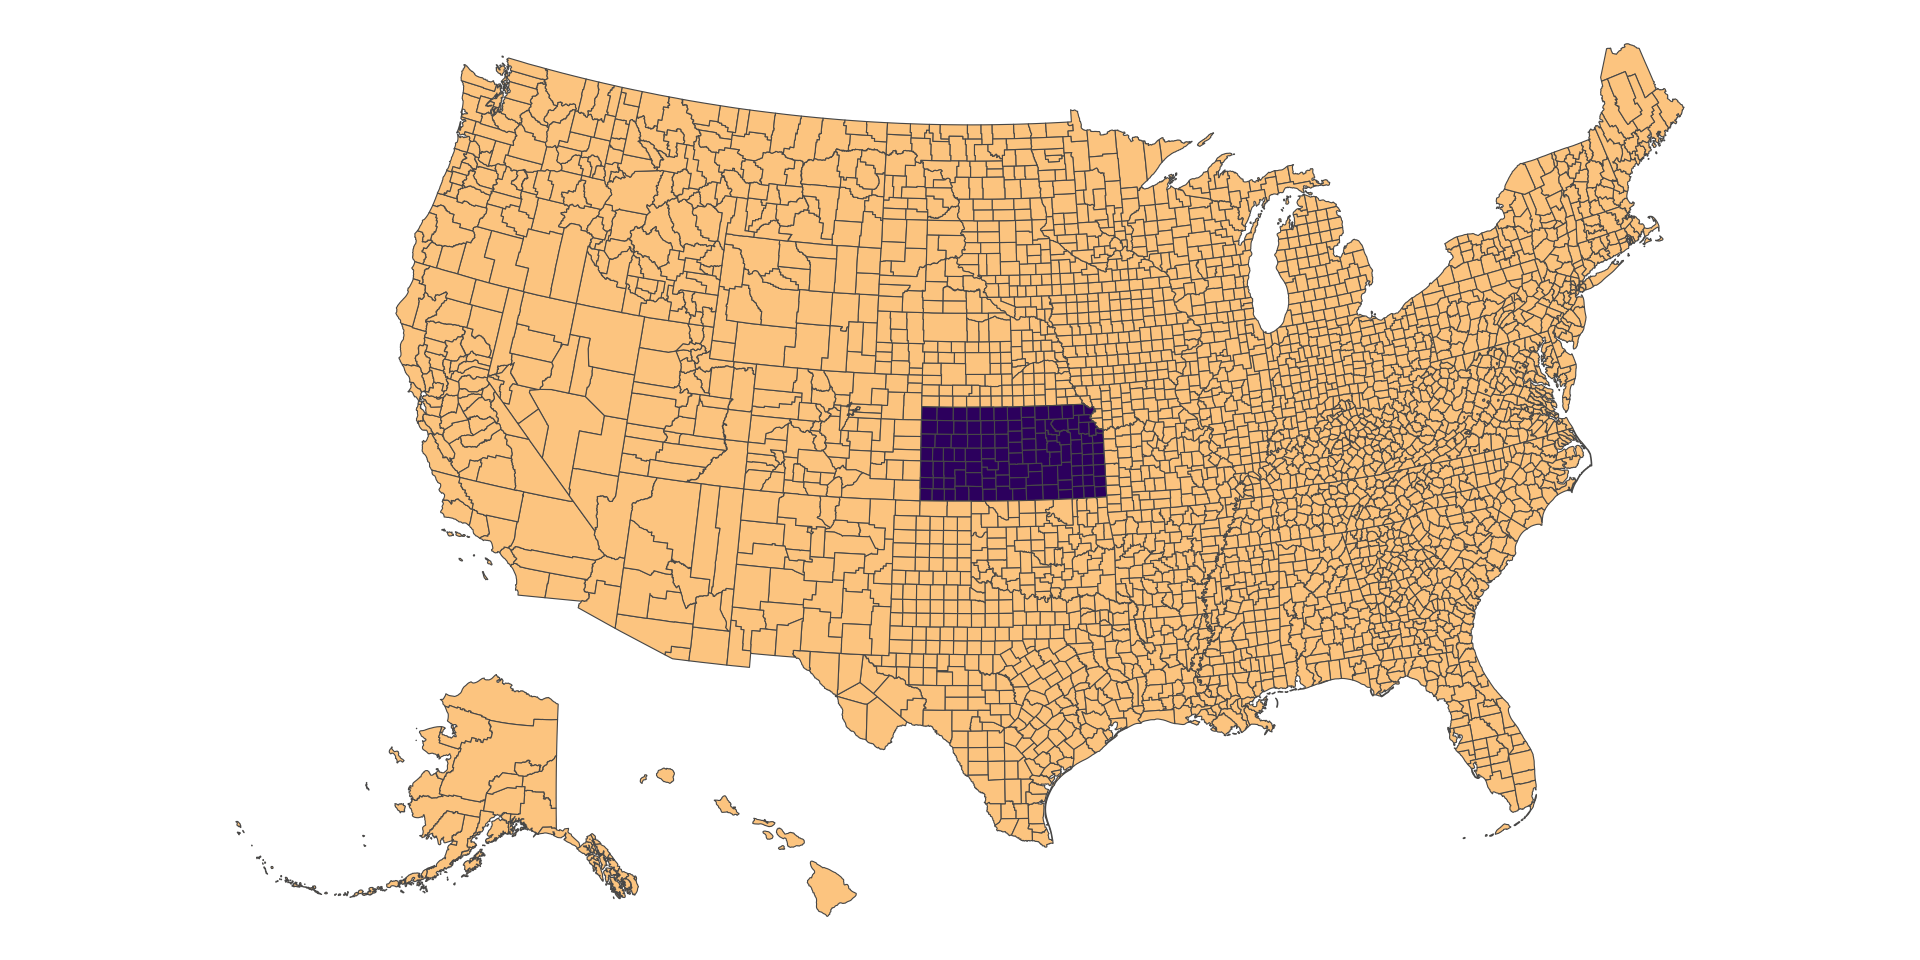
Web Scraping
library(flynnprojects)
library(rvest) # Load rvest package for web scraping
sysfonts::font_add_google("Oswald", family = "oswald") # Enable custom font
showtext::showtext_auto()
showtext::showtext_opts(dpi = 300)

url <- "https://en.wikipedia.org/wiki/Gordon_Ryan" # Paste a link to Gordon Ryan's Wikipedia page
read_page <- read_html(url)                        # Feed url into function
read_tables <- html_table(read_page)[[4]]          # Pull win/loss table from table 4

time_series <- read_tables |>                      # Create separate year variable
  mutate(year = stringr::str_extract(Year, "\\d\\d\\d\\d")) |> # Extract year
  group_by(year) |>                                      # Group by year and type
  dplyr::summarise(total_count = n(),                    # Generate summary counts
                   win_count = sum(Result=="Win")) |>
  pivot_longer(cols = c("total_count", "win_count")) |>  # Reshape to tidy format
  mutate(name = factor(name,                             # Edit variable labels
                       levels = c("win_count", "total_count"),
                       label = c("Wins", "Total Matches")),
         year = as.numeric(year))                        # Make year numeric from char

ggplot(time_series,                                     #Plot data
       aes(x = year,                                    # Set aesthetics
           y = value,
           color = name)) +
  geom_line(linewidth = 1.5,                              # Line geom
            position = position_dodge(width = 0.2)) + # Add some dodge to help w/overlap
  geom_point(size = 3.0,                                  # Point geom
             position = position_dodge(width = 0.2)) +
  scale_x_continuous(limits = c(2012, 2022),              # Customize scale
                     breaks = seq(2012, 2022, 1)) +
  flynnprojects::theme_flynn(base_family = "oswald") +
  viridis::scale_color_viridis(option = "turbo",
                               discrete = TRUE,
                               begin = 0.1,
                               end = 1.0) +
  labs(x = "Year",
       y = "Count",
       color = "Count",
title = "Gordon Ryan's Wins and Total Matches, 2012—2022") 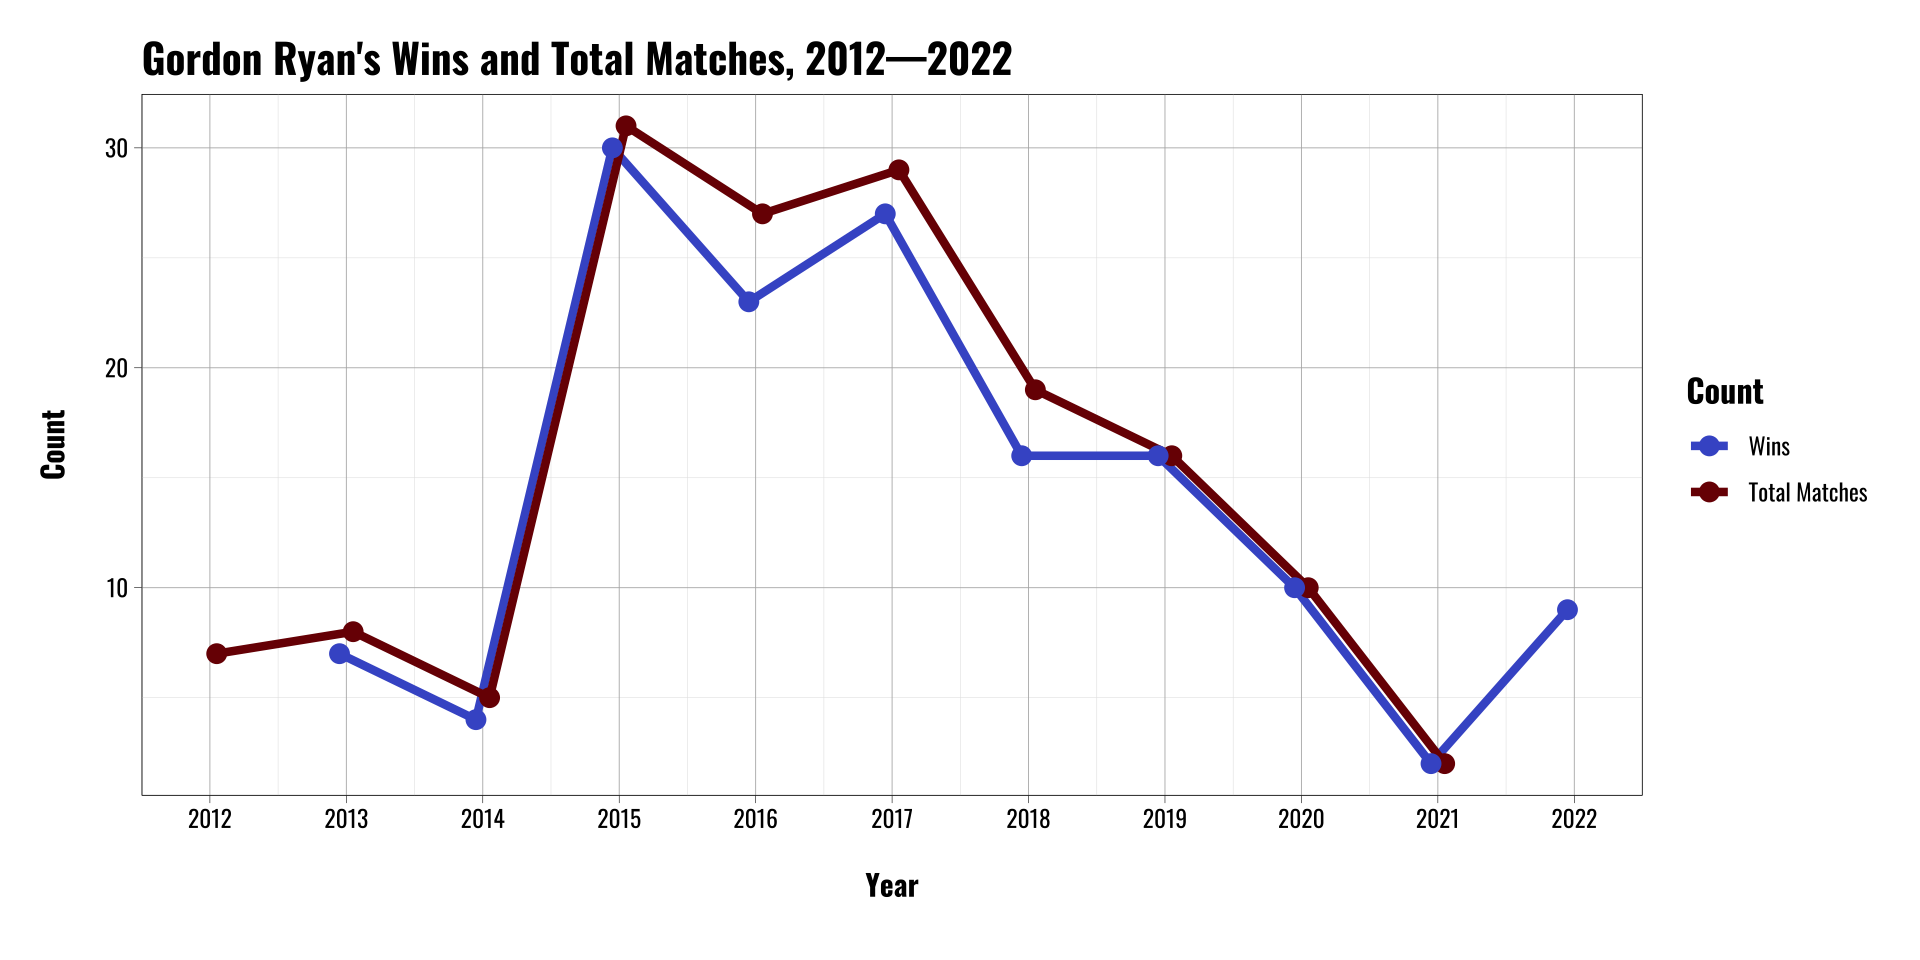
Social Science Workflow